
Effect Size: What It Is and Why It Matters More Than Statistical Significance
A result can be statistically significant — yet practically meaningless. Learn how effect size reveals the real-world impact of research findings.
Introduction: The Hidden Problem with p-values
You’ve probably seen headlines like:
“New Study Shows Coffee Improves Memory!”
But what if the improvement was just 0.3 points on a 100-point test?
Technically “significant” — but is it meaningful?
This is where effect size comes in.
While p-values tell us whether an effect exists, effect size tells us how large that effect is — a crucial distinction often overlooked in science, education, and media.
In this article, you’ll learn:
- What effect size really means
- How to calculate and interpret common measures (like Cohen’s d)
- Why it’s essential for sound scientific reasoning
- Best practices for reporting it in research
Let’s go beyond significance testing and focus on what truly matters: practical importance.
What Is Effect Size?
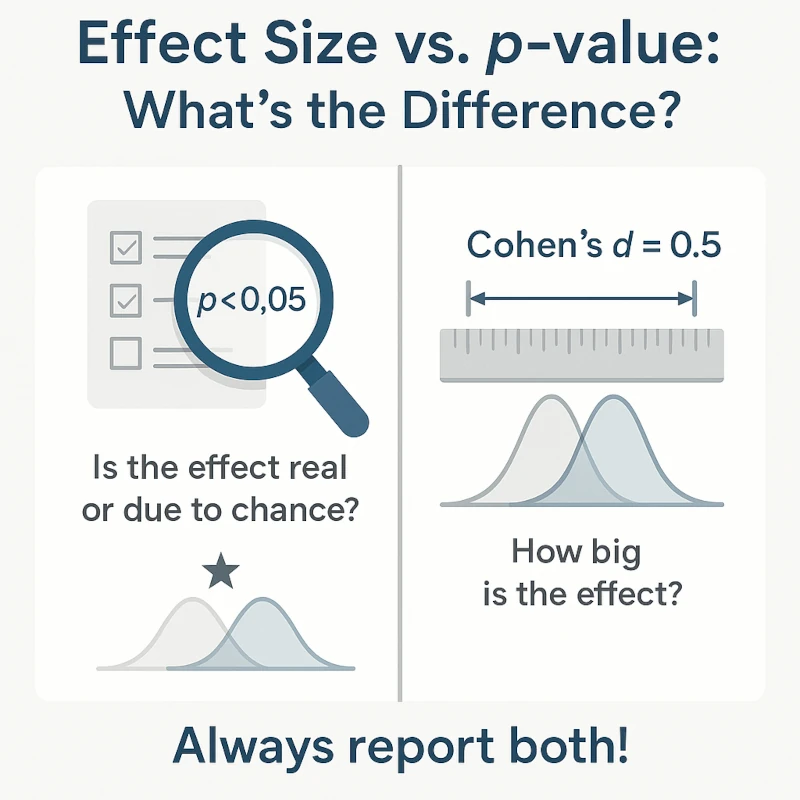
Effect size is a quantitative measure of the magnitude of a phenomenon. Unlike p-values, which depend heavily on sample size, effect size provides a standardized metric that reflects the strength of a relationship or difference — independent of how many people were studied.
In simple terms:
p-value: “Is there an effect?” → answers statistical significance
Effect size: “How big is the effect?” → answers practical significance
For example:
Two teaching methods differ by 5 points in average test scores.
With a small class, the difference might not be significant (high p-value).
With a huge sample, even a 0.5-point difference could be “significant” (low p-value).
But only effect size tells you whether those 5 (or 0.5) points matter in practice.
Effect Size vs. Hypothesis Testing: Key Differences
| Feature | p-value / Null Hypothesis Testing | Effect Size |
|---|---|---|
| Purpose | Test if an effect is likely due to chance | Measure the strength of the effect |
| Depends on sample size | Yes — larger samples increase significance | No — it’s independent of N |
| Tells you | Whether an effect exists | How large the effect is |
| Common misuse | Mistaking statistical significance for importance | Ignoring it altogether |
Key insight: A small effect can be highly significant with a large sample — but still too weak to justify policy changes, clinical use, or educational reform.
How to Calculate Effect Size: Cohen’s d
One of the most widely used measures is Cohen’s d, ideal for comparing the means of two groups.
Formula:
$d = \frac{\bar{X}_1 – \bar{X}_2}{s_{\text{pooled}}}$
Where:
\(\bar{X}_1\) and \(\bar{X}_2\) are the means of the two groups
\(s_{\text{pooled}}\) is the pooled standard deviation:
\[ s_{\text{pooled}} = \sqrt{\frac{(n_1 – 1)s_1^2 + (n_2 – 1)s_2^2}{n_1 + n_2 – 2}} \]
If group sizes are equal, you can approximate \(s_{\text{pooled}}\) as the average of the two standard deviations
Example: Teaching Method Experiment
| Group | Mean Score | SD | N |
|---|---|---|---|
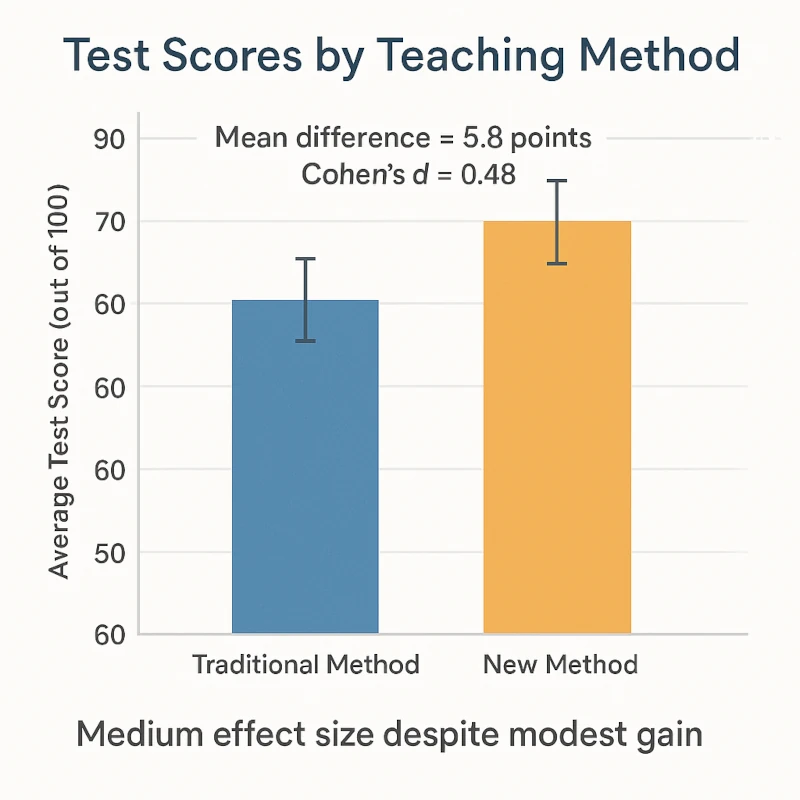
| New Method | 78.4 | 12.1 | 30 |
| Traditional | 72.6 | 11.8 | 30 |
- Difference in means: \(78.4 – 72.6 = 5.8\)
- Pooled SD ≈ \(\sqrt{\frac{12.1^2 + 11.8^2}{2}} \approx 11.95\)
- Cohen’s d = \( \frac{5.8}{11.95} \approx 0.48 \)
Interpretation: d ≈ 0.48 → medium effect size
Even without knowing the p-value, we now know the intervention had a moderately strong impact.
Interpreting Cohen’s d: Rules of Thumb
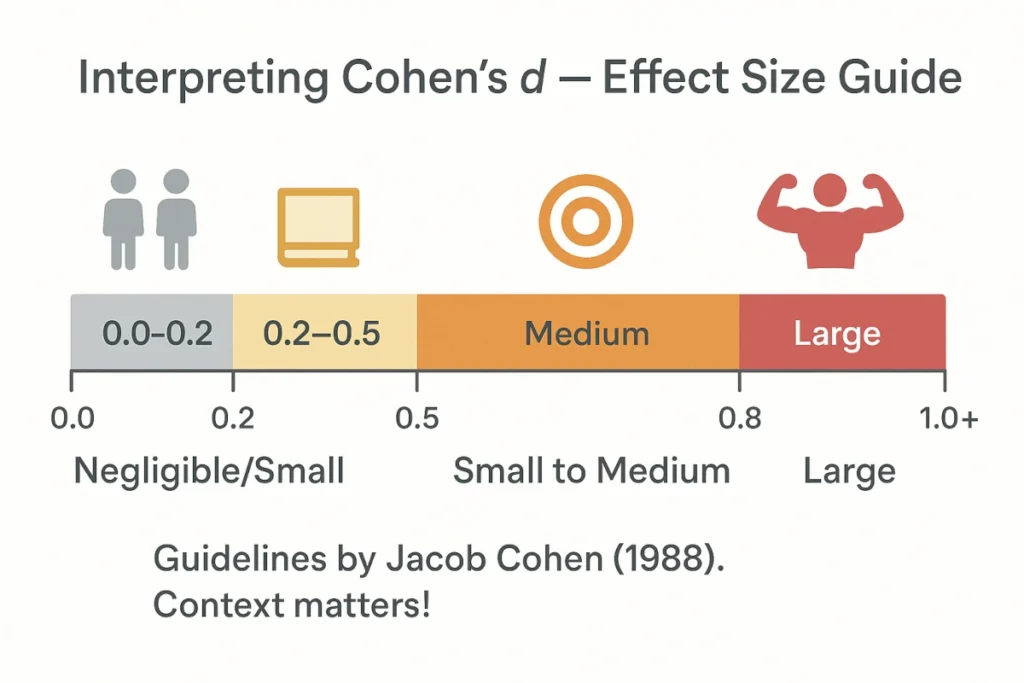
Jacob Cohen proposed general guidelines for interpreting d:
| Cohen’s d | Interpretation |
|---|---|
| 0.2 | Small effect |
| 0.5 | Medium effect |
| 0.8 | Large effect |
These are benchmarks, not strict rules. Context matters: in education, a d of 0.4 might be very meaningful, in medicine, even d = 0.3 could justify a new treatment if scalable.
Use them as starting points — not final judgments.
When Should You Report Effect Size?
Best practices recommend reporting effect size in all empirical studies, especially when:
- Comparing groups (t-tests, ANOVA)
- Measuring associations (correlations, regression)
- Conducting meta-analyses
- Evaluating interventions (education, psychology, health)
Major journals (APA, APA-style publications) require effect sizes alongside p-values.
Other Common Effect Size Measures
While Cohen’s d is great for mean differences, other contexts require different metrics:
| Test | Effect Size | Range |
|---|---|---|
| t-test (independent) | Cohen’s d, Hedges’ g | −∞ to +∞ |
| ANOVA | Eta-squared (η²), Omega-squared (ω²) | 0 to 1 |
| Correlation | Pearson’s r | −1 to +1 |
| Chi-square | Cramer’s V | 0 to 1 |
| Regression | R², f² | 0 to 1 |
Why Effect Size Matters Researchers
Understanding effect size helps you:
- Avoid overinterpreting statistically significant but trivial results
- Compare findings across different studies and scales
- Design better experiments (via power analysis)
- Communicate results more honestly and transparently
Power analysis — used to determine required sample size — depends directly on expected effect size.
No effect size? You can’t plan a well-powered study.
Conclusion: Significance ≠ Importance
Let’s summarize the key takeaways:
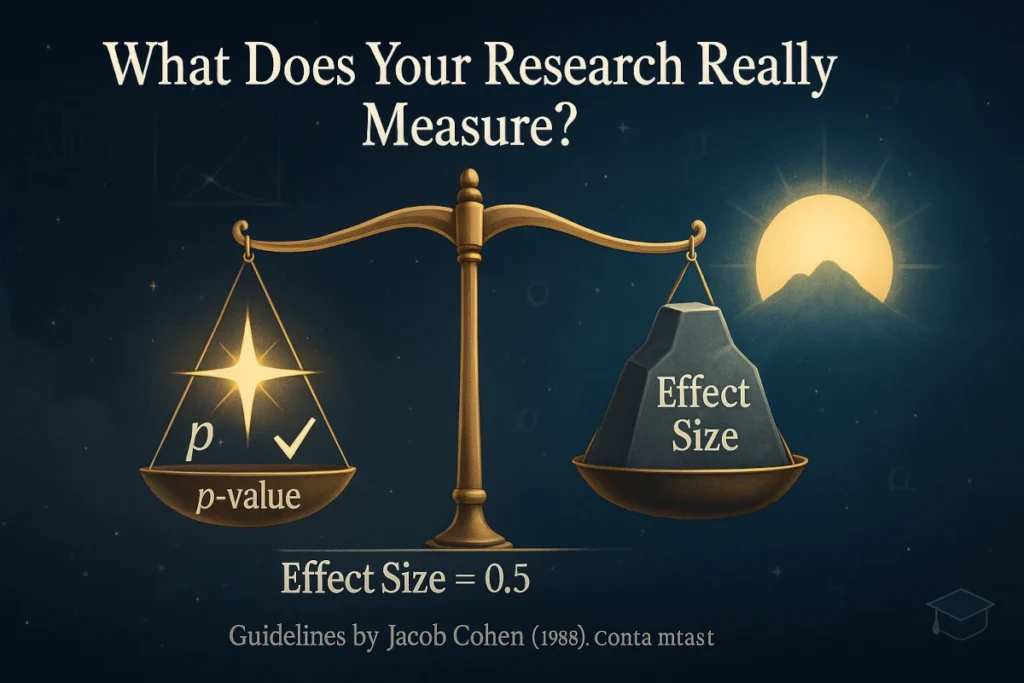
- p-value answers: “Is the effect real?”
- Effect size answers: “How big is it?”
- A result can be significant but trivial — always check both.
- Cohen’s d is a powerful tool
- Interpret using benchmarks: 0.2 (small), 0.5 (medium), 0.8 (large) — but consider context.
Statistical significance tells you if you should pay attention. Effect size tells you how much.
Further Reading
Schober, Patrick MD, PhD, MMedStat*; Vetter, Thomas R. MD, MPH†. Effect Size Measures in Clinical Research. Anesthesia & Analgesia 130(4):p 869, April 2020. | DOI: 10.1213/ANE.0000000000004684
Kallogjeri D, Piccirillo JF. A Simple Guide to Effect Size Measures. JAMA Otolaryngol Head Neck Surg. 2023 May 1;149(5):447-451. doi: 10.1001/jamaoto.2023.0159. PMID: 36951858.
Aarts S, van den Akker M, Winkens B. The importance of effect sizes. Eur J Gen Pract. 2014 Mar;20(1):61-4. doi: 10.3109/13814788.2013.818655. Epub 2013 Aug 30. PMID: 23992128.
Paul Monsarrat, Jean-Noel Vergnes, The intriguing evolution of effect sizes in biomedical research over time: smaller but more often statistically significant, GigaScience, Volume 7, Issue 1, January 2018, gix121, https://doi.org/10.1093/gigascience/gix121
Pereira, T. V., Horwitz, R. I., & Ioannidis, J. P. A. (2012). Empirical evaluation of very large treatment effects in randomized controlled trials. JAMA, 308(16), 1689–1696. https://doi.org/10.1001/jama.2012.13444
“The primary product of a research inquiry is one or more measures of effect size, not p-values.” — Jacob Cohen (1994)