micheledpierri.com: statistics, data analysis and coding

Nexus of Statistics, Data analysis, Coding, Art and Medicine

Menu
  • Home
  • Courses
    • Python Foundation
    • Statistics
    • Data Analysis
    • Machine Learning
  • Blog
    • All Pages
    • Health Informatics
    • Programming
    • Art
  • Illustrations
  • About
  • Contact
Menu
Home / Archives for Michele Danilo Pierri / Page 8

Author: Michele Danilo Pierri

Michele D. Pierri is a cardiac surgeon and cardiovascular physiopathology researcher with a strong interest in artificial intelligence, medical data science, clinical decision support, and digital health. His work focuses on the intersection between medicine, technology, and computational methods, with the aim of translating complex biomedical concepts into clear, practical, and clinically meaningful insights.

The Anatomy Lesson of Dr. Nicolaes Tulp

Posted on July 23, 2024August 8, 2026 by Michele Danilo Pierri

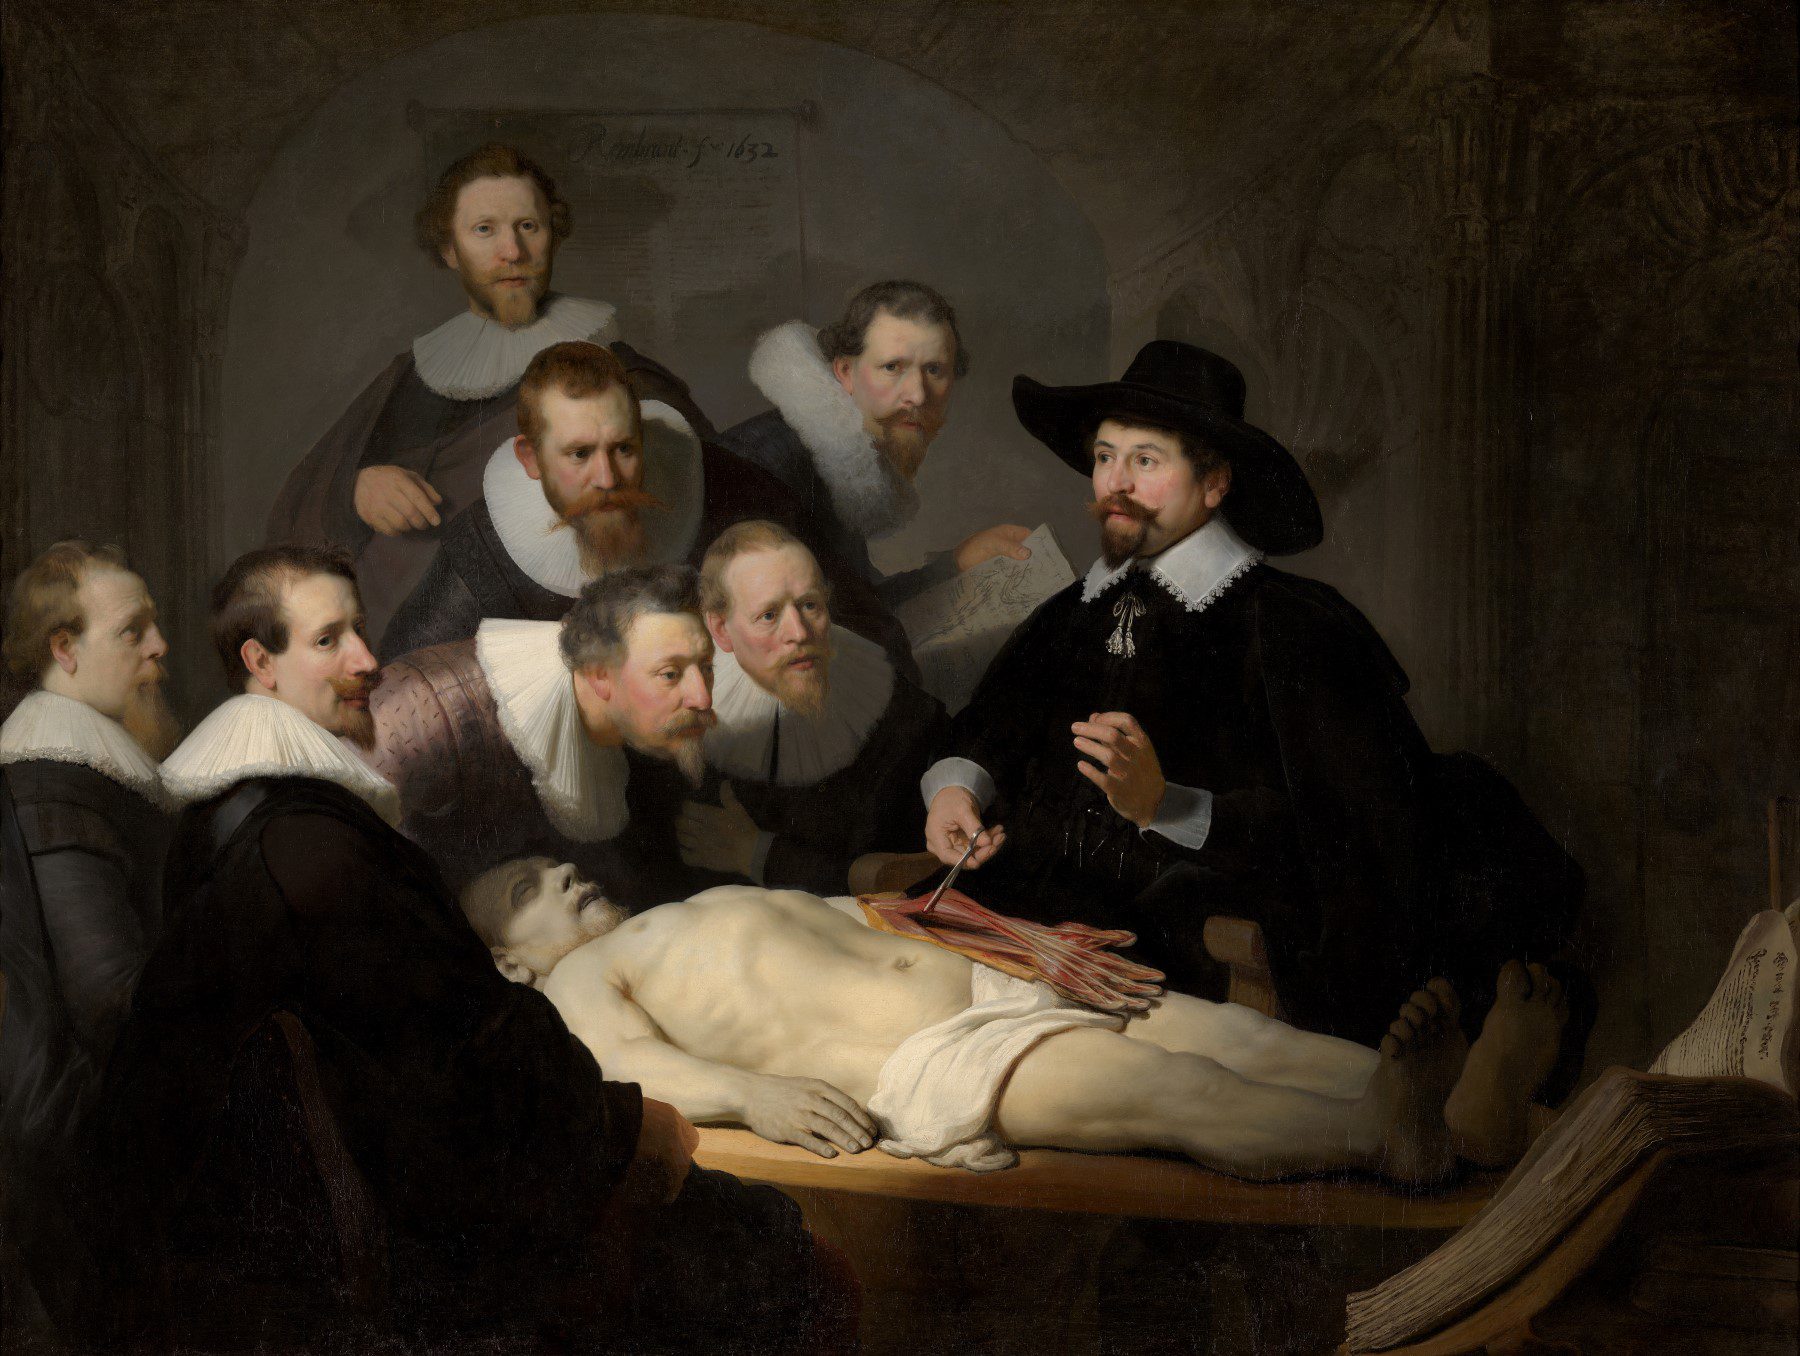
The painting “Anatomy Lesson of Dr. Tulp” is one of Rembrandt’s masterpieces, currently housed at the Mauritshuis museum in The Hague, Netherlands. Created in 1632, it is significant not only as an exceptional example of Baroque art but also as an important historical document of medical history and anatomical practices.

The Artist

Rembrandt Harmenszoon van Rijn, commonly known simply as Rembrandt, was born on July 15, 1606, in Leiden. He is considered one of the greatest painters in the history of art. He primarily worked in Amsterdam, gaining fame for his portraits, self-portraits, and historical scenes, showcasing his skill in using light and shadow and his ability to convey vivid portrayals of the human condition.

The Painting

“Anatomy Lesson of Dr. Tulp” was commissioned by the Amsterdam Guild of Surgeons and marked a pivotal moment in Rembrandt’s career, solidifying his reputation as a talented portraitist. The subject of the painting is Dr. Nicolaes Tulp, a surgeon and anatomy lecturer, depicted conducting a lesson. The cadaver is that of a criminal, Aris Kindt, who had been executed for theft. Tulp is surrounded by seven members of the Guild of Surgeons to whom he is giving a lesson. The painting vividly captures the event, significant both scientifically and socially at the time, with great realism and detail.
The scene is set in a dimly lit anatomical theater; Dr. Tulp is identifiable by his black attire and wide-brimmed hat, signifying his professional status. He is shown illustrating the muscles of the cadaver’s left arm, which lies supine on the table, using anatomical forceps. The seven guild surgeons are arranged in a semicircle, formally dressed, and their faces show concentration and interest.
The painting measures 169.5 cm by 216.5 cm and is executed in oil on canvas. Noteworthy is the use of chiaroscuro to draw attention to the center of the work. There is a strong contrast between the dark background and the brightly lit cadaver and Dr. Tulp.
Also notable are the precise anatomical details, demonstrating the artist’s careful observation of the human body. The expressions and postures of the surgeons add a psychological dimension to the scene.

The Protagonist

Dr. Nicolaes Tulp, originally named Claes Pieterszoon, was born on October 9, 1593, and died on September 12, 1674. He lived during a particularly prosperous period for the Netherlands, marked by the growth of the Dutch East India Company and the development of extensive international trade.
Tulp was a renowned physician, a member of the Amsterdam Guild of Surgeons, and conducted several public anatomy lessons, an activity reserved only for high-ranking doctors. In 1641, he published the book “Observationes Medicae,” a collection of clinical cases that gained wide circulation and was translated into several languages. Besides his medical career, Tulp was also a politician, becoming a member of the city council and later the mayor of Amsterdam.

Historical Context

In addition to its undeniable artistic values, “Anatomy Lesson of Dr. Tulp” is a valuable document of medical history. In the 17th century, human dissection was a relatively new and controversial practice, beginning to develop thanks to the gradual relaxation of religious restrictions.
Public anatomy lessons were crucial opportunities for educating doctors and advancing anatomical knowledge.

The historical observation of Rembrandt’s fresco highlights two fundamental aspects that shaped the organization of medicine in that historical period.

Firstly, we must emphasize the emancipation of the surgeon’s role compared to that of the physician. Initially, surgeons were considered inferior to physicians: physicians had university education and dealt with non-invasive treatments; surgeons were regarded as craftsmen engaged in manual tasks like amputations and fracture reductions.

This distinction was particularly clear in the Middle Ages and the Renaissance, but later, around the 17th century, the surgeon’s role began to gain importance and prestige.
This was primarily due to the expansion of surgical techniques and improved outcomes, which in turn resulted from a more detailed understanding of the human body. The publication and dissemination of Andreas Vesalius’s text “De humani corporis fabrica” in 1543 certainly contributed to this knowledge. The spread of the knowledge of the successes and techniques of some great surgeons, like Ambroise Paré (1510-1590), considered the father of surgery, also had a significant impact.

Furthermore, “schools of surgery” began to emerge, offering structured training for surgeons comparable to that of physicians. Guilds, which were common in many European cities, were professional organizations of merchants and craftsmen that regulated their respective trades.
The Amsterdam Guild of Surgeons played a pivotal role in ensuring that only qualified individuals could practice surgery. The Guild not only examined and certified surgeons but also provided education and training.

IIn this context, the anatomy lessons given by the Amsterdam Guild’s most prestigious doctors, such as Dr. Tulp, were highly significant. These lessons often included dissections of cadavers, usually of executed criminals, and were public, meaning they were open not only to doctors but also to the general public.

The Amsterdam Guild played a fundamental role in the development and dissemination of modern surgery. Commissioning the painting from the already famous Rembrandt was not only a celebration of one of its most prestigious members but also aimed to demonstrate the importance of training and the prestige achieved by the surgical profession.

Early 20th-century physician using an optical device to examine an illuminated human skeleton in a vintage medical laboratory.

Exploring DICOM

Posted on July 17, 2024July 28, 2026 by Michele Danilo Pierri

DICOM stands for Digital and Communications in Medicine and is used for managing medical data. One of the most common uses of this format is the storage, transfer, and display of diagnostic images like X-rays, CT scans, and MRIs.

While there are variations depending on the type of image and the manufacturer of the equipment that generated it, a DICOM file contains some common elements:

  • HEADER: The initial part of the file contains metadata describing its content (patient identification, image acquisition modality, parameters for acquiring the images, equipment manufacturer, etc.).
  • ATTRIBUTE GROUPS: The metadata in the header is organized into attribute groups containing a series of DICOM tags that provide specific information. For example, tag 0010,0010 specifies the patient’s name.
  • TRANSFER SYNTAX: Specifies how the data is encoded and stored.
  • IMAGE: Contains the pixels or voxels that make up the image, which may be compressed or uncompressed.
  • TRAILER: Indicates the end of the DICOM file and may be absent.

The main attributes of a DICOM file include:

  • PatientName: Patient’s name.
  • PatientAge: Patient’s age.
  • StudyDate: Date of the study.
  • StudyDescription: Study description.
  • Modality: Imaging modality used (e.g., CT, MR, X-ray, etc.).
  • Manufacturer: Imaging equipment manufacturer.
  • Rows: Number of rows in the image.
  • Columns: Number of columns in the image.
  • PixelData: Image pixel data.
  • ImageOrientationPatient: Image orientation relative to the patient.
  • ImagePositionPatient: Spatial position of the image relative to the patient.
  • SliceThickness: Slice thickness in an imaging volume.
  • PixelSpacing: Pixel spacing in the image.

When examining a DICOM file related to angiographic images, the modality will be XA. The study type attribute will specify whether it is coronary, cerebral, or another type of angiography. The sequence type attribute indicates the direction of the subsequent images (anteroposterior, lateral, oblique). The number of images in the sequence is usually indicated by the “NumberOfFrames” tag.


A very useful library for working with DICOM files in Python is pydicom. It is the one we will use for all work on DICOM files.

Before accessing it, you need to install it by running the following command in the terminal:

pip install pydicom

The following program reads the attributes of the DICOM (.dcm) file specified in the “dicom_file_path” variable.

import pydicom

def print_dicom_attributes(dicom_file):
    # Load the DICOM file
    ds = pydicom.dcmread(dicom_file)

    # Iterate over all data elements in the DICOM dataset
    for element in ds:
        # Extract the tag, name, and value of the DICOM attribute
        tag = element.tag
        name = element.name
                
        # Print the attribute information
        print(f"Tag: {tag}, Name: {name}")

if __name__ == "__main__":
    # Specify the path to the DICOM file
    dicom_file_path = "path/to/your/dicom/file.dcm"

    # Call the function to print DICOM attributes
    print_dicom_attributes(dicom_file_path)

The list of attributes obtained is often very long and not very useful.

We can limit the number of attributes to those we are interested in and read their contents. In the following program, we created a dictionary containing some specific attributes and read them:

import pydicom

def print_important_dicom_attributes(dicom_file):
    # Load the DICOM file
    ds = pydicom.dcmread(dicom_file)
    
    # Define a list of important tags to print
    important_tags = {
        "PatientName": "Patient's Name",
        "PatientID": "Patient's ID",
        "PatientBirthDate": "Patient's Birth Date",
        "PatientSex": "Patient's Sex",
        "StudyID": "Study ID",
        "StudyDate": "Study Date",
        "StudyTime": "Study Time",
        "SeriesNumber": "Series Number",
        "Modality": "Modality",
        "Rows": "Number of Rows in Image",
        "Columns": "Number of Columns in Image",
        "NumberOfFrame": "Number of Frames in Sequence 
        }

    # Iterate over the important tags and print their values
    for tag, description in important_tags.items():
        if tag in ds:
            value = ds.data_element(tag).value
            print(f"{description} ({tag}): {value}")
        else:
            print(f"{description} ({tag}): Not Available")

if __name__ == "__main__":
    # Specify the path to the DICOM file
    dicom_file_path = "path/to/your/dicom/file.dcm"

    # Call the function to print important DICOM attributes
    print_important_dicom_attributes(dicom_file_path)

The output is as follows:

  • Patient’s Name (PatientName): XXXXXX^XXXXXX
  • Patient’s ID (PatientID): 000000000000000000
  • Patient’s Birth Date (PatientBirthDate): 19000402
  • Patient’s Sex (PatientSex): M
  • Study ID (StudyID): 2020000
  • Study Date (StudyDate): 20200000
  • Study Time (StudyTime): 084611.000
  • Series Number (SeriesNumber): 1
  • Modality (Modality): XA
  • Number of Rows in Image (Rows): 512
  • Number of Columns in Image (Columns): 512
  • Number of Frames in Sequence (NumberOfFrames): 86

In an upcoming article, we will delve into the part of the file containing the image pixels to view and manage them.

A large coiled snake among antique medicines, syringes, and apothecary bottles in an early twentieth-century hospital ward.

Python in Healthcare Data

Posted on July 14, 2024July 29, 2026 by Michele Danilo Pierri

Introduction

Python has become an increasingly vital tool for analyzing healthcare data. It is a widely used programming language. According to the PYPL (Popularity of Programming Language) index, it ranks as the world’s most popular programming language, commanding a 30.7% market share. By comparison, Java holds 14.89% and JavaScript 7.78% of the market.

Python’s success stems from its power, versatility, and user-friendly design. With its clear, readable syntax and gentler learning curve compared to other languages, Python is accessible to many users.

Its multi-paradigm nature — supporting imperative, functional, and object-oriented programming — lets developers choose the most suitable approach for each task.

Furthermore, an active developer community has created extensive libraries and frameworks that enhance Python’s capabilities and ease of use.

With powerful libraries like TensorFlow, Keras, and Scikit-learn, Python has become the preferred language for machine learning and artificial intelligence development.

When properly implemented following best practices, these Python libraries can analyze healthcare data to enhance patient diagnosis and treatment outcomes.

In this article, we will briefly explore how to use Python to analyze healthcare data, covering the entire process from data import to results visualization.

Essential Python Libraries for Healthcare Data Management

Numpy and Pandas

These are are two essential Python libraries for data analysis, each with complementary functionalities particularly useful in healthcare.

NumPy provides the mathematical foundation for scientific computing in Python through high-performance multidimensional arrays and numerous mathematical functions that enable efficient complex calculations. This library allows for biomedical signal processing, diagnostic image analysis, and supports advanced statistical algorithms necessary for interpreting clinical data.

Pandas, on the other hand, focuses on structured data manipulation and analysis through its main data structures, DataFrame and Series, which greatly facilitate working with tabular information. In healthcare, Pandas excels in managing electronic health records, epidemiological data, and time series of clinical parameters, offering robust functionality for data cleaning, handling missing values, and information aggregation.

These two libraries are typically used in combination: NumPy provides the computational power necessary for underlying mathematical operations, while Pandas offers an intuitive interface to manipulate and explore healthcare datasets, enabling researchers and industry professionals to extract meaningful information, identify trends in patient data, and develop predictive models to improve diagnosis and treatments.

Pyhealth

Pyhealth is a specialized library for developing machine learning applications in healthcare. It supports major medical databases like MIMIC-III, MIMIC-IV, and eICU, providing base outputs for MIMIC-III. The library includes templates for key predictions such as readmission risk, length of stay, and treatment recommendations. It enables users to build predictive models and evaluate their performance. The library also supports over 20 medical coding systems, including ICD-9 and ICD-10, for diagnoses, treatments, and medications.

Lifelines

Lifelines is a tool for survival analysis using various techniques, including Kaplan-Meier, Nelson-Aalen, and regression. It covers most parametric and non-parametric methods and supports the creation of related graphs. Lifelines features an intuitive design and a scikit-learn-like API, making it easily accessible to data scientists and researchers who are already familiar with Python’s ecosystem.

Biopython

BioPython is a powerful tool for analyzing molecular and computational biology. The library streamlines common bioinformatics tasks, enabling researchers to concentrate on interpreting results instead of managing data.

Nilearn

Nilearn is a Python library for neuroimaging analysis and visualization built on scikit-learn. It is an essential tool for neuroscientists and researchers working with neuroimaging data, especially functional magnetic resonance imaging (fMRI).

By connecting traditional neuroimaging analysis with machine learning, Nilearn makes advanced statistical techniques more approachable for neuroscientists. Its comprehensive documentation, complete with tutorials and examples, ensures accessibility even for newcomers to the field.

The library integrates with Python’s scientific ecosystem—including NumPy, SciPy, Matplotlib, and scikit-learn—enabling efficient workflows in neuroscientific research.

Pymedtermino

It is a useful library for managing medical terminology. It supports various standards like ICD-10 and is beneficial for coding and analyzing healthcare data.

Pymc

Pymc is a package for running models based on Bayesian statistics, ideal for building healthcare models like predicting outcomes.

Libraries based on FHIR

FHIR (Fast Healthcare Interoperability Resources) is a standard developed by HL7 (Health Level Seven) for exchanging healthcare information between various systems and devices. Several Python packages are available for working with FHIR: Fhir.resources – Google-fhir-py – Fhirpack

Libraries for Medical Image Visualization

A crucial aspect of healthcare applications is managing and visualizing medical images. Python libraries are numerous and vital for creating these visual applications:

Matplotlib

Though not specifically designed for image visualization, Matplotlib excels in creating and displaying 2D and 3D graphs and images.

ITK

ITK is a tool that enables multidimensional image analysis and segmentation, especially for CT or MRI images. It also allows the alignment of images from various sources. SimpleITK, built on ITK, offers numerous image manipulation tools. These tools are powerful and widely used.

Medpy

Medpy is a collection of scripts that lets you manipulate, read, and write medical images in Python. Based on SimpleITK, Medpy supports numerous formats, from DICOM to those of the Neuroimaging Informatics Technology Initiative, Nrrd, MINC, GIPL, microscopic images, PNG, JPG, JPEG, TIFF, BMP, and more. It also enables feature extraction for use in machine learning programs like Scikit-Learn.

Scikit-image

It’s a collection of algorithms for image processing.

Pydicom

Pydicom is a Python library for working with DICOM files—reading, manipulating, and saving them. As a native Python application, it is easy for users to utilize.


To use these libraries in Python, you need to first install them on your system and then import them into your code. We recommend installing in a virtual environment, as shown in other articles on this blog.

Typically, installation is done by typing in the terminal, in pip environment:

pip install namelibrary

In Conda environment:

conda install -c conda-forge namelibrary

Generally, libraries installed with pip and those installed in a Conda environment are separate and not automatically accessible to each other. This difference arises because pip and Conda manage environments and dependencies differently. If you use both environments, it is advisable to perform both installations.

Some libraries need specific commands for installation. You can find detailed instructions on their respective linked Pyp pages.

After the installation is complete, you can import the library into your projects using the import statement:

import namelibrary 
## or, if use with alias

import namelibrary as alias

  • Previous
  • 1
  • …
  • 5
  • 6
  • 7
  • 8
© 2024–2026 micheledpierri.com · Privacy Policy · Impressum